
Introduction to Pandas for Data Science: A Beginner's Guide (Part Two)
Part two of Pandas. This part will cover what to do with missing data, how to group by, merging DataFrames together, and more.

Missing Data
Sometimes you might get missing values and pandas will show it as NaN. Here are a few methods to fill in those missing values or fill in those missing values.
Well first, I’m going to create some missing values using np.nan:

Drop Values
First, we’re going to explore how to drop values.
We can use dropna() to drop any rows that contain a NaN value:

So as you can see, it drop rows 1 and 2 because they each contain NaN values
If you want to drop columns then we can specify using dropna(axis=1):

This would drop all the columns that contain NaN values.
You can also specify a threshold. This would give you rows that pass a certain threshold. So in this case, I specify the threshold to be 2:

This gave me back row 1 because it has 2 values.
Fill-in Values
We can use fillna() to fill in values. In this case, I fill in the missing values with a string called ‘Value’:

Normally you would want to fill in the missing values with a mean number. You can do so by writing in the column you want to fill in and writing mean() at the end just like:

This would give you the mean of that column.
Groupby
Groupby will allow you to group together rows based on columns and be able to perform aggregate functions on it. This is similar to SQL group by.
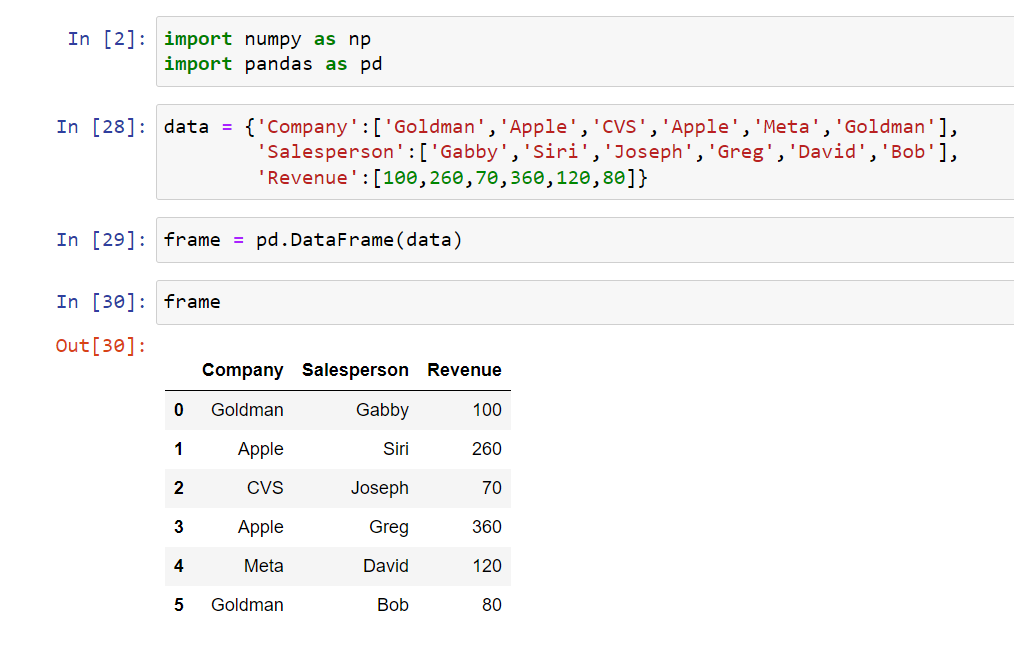
First I’m going to give you random data I’ve created:
In order to group by we use groupby() and you’ll pass in a column you want:
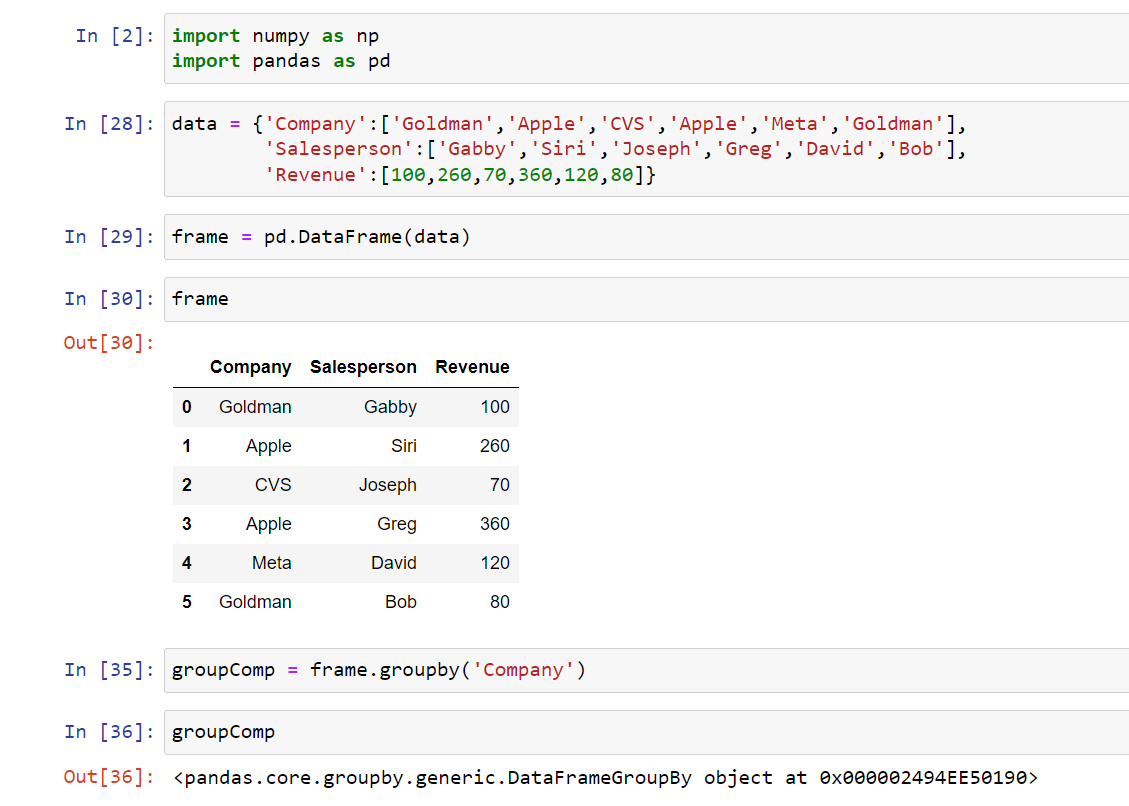
This would give you a group by object.
After that, you can call some sort of aggregate function on it. So for example, if I wanted to get the mean, I can put mean() after groupComp and it’ll give me the average revenue by the company:

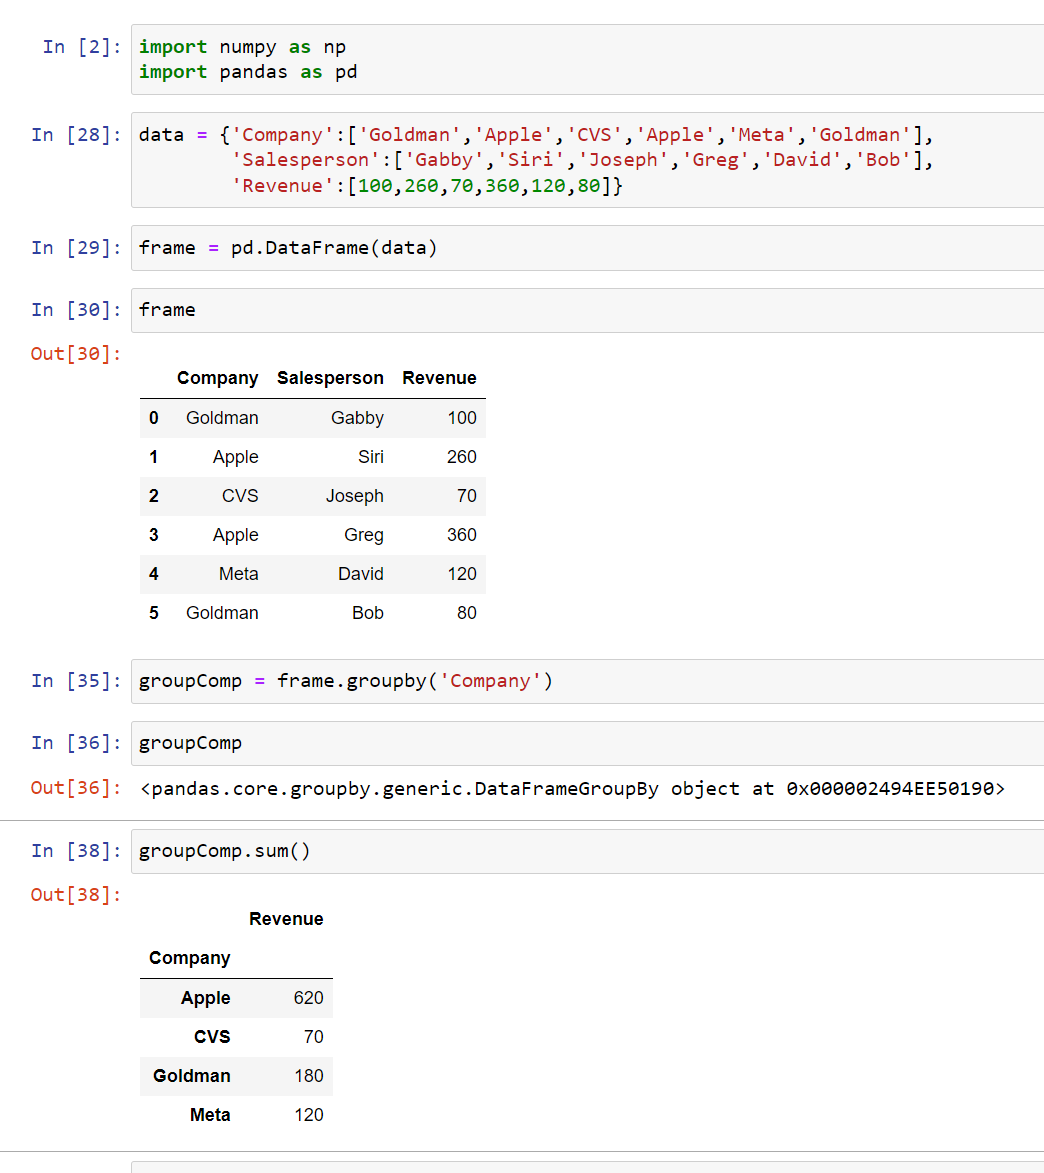
If I wanted to get the sum I can put sum():
All of this gives you a data frame, so you can index off of sum(), mean(), or std(). So if I want to locate Apple, I can write loc[‘Apple’] after sum():

Once you start getting used to Pandas, you don’t have to call a variable, you can just write group by after the data frame:
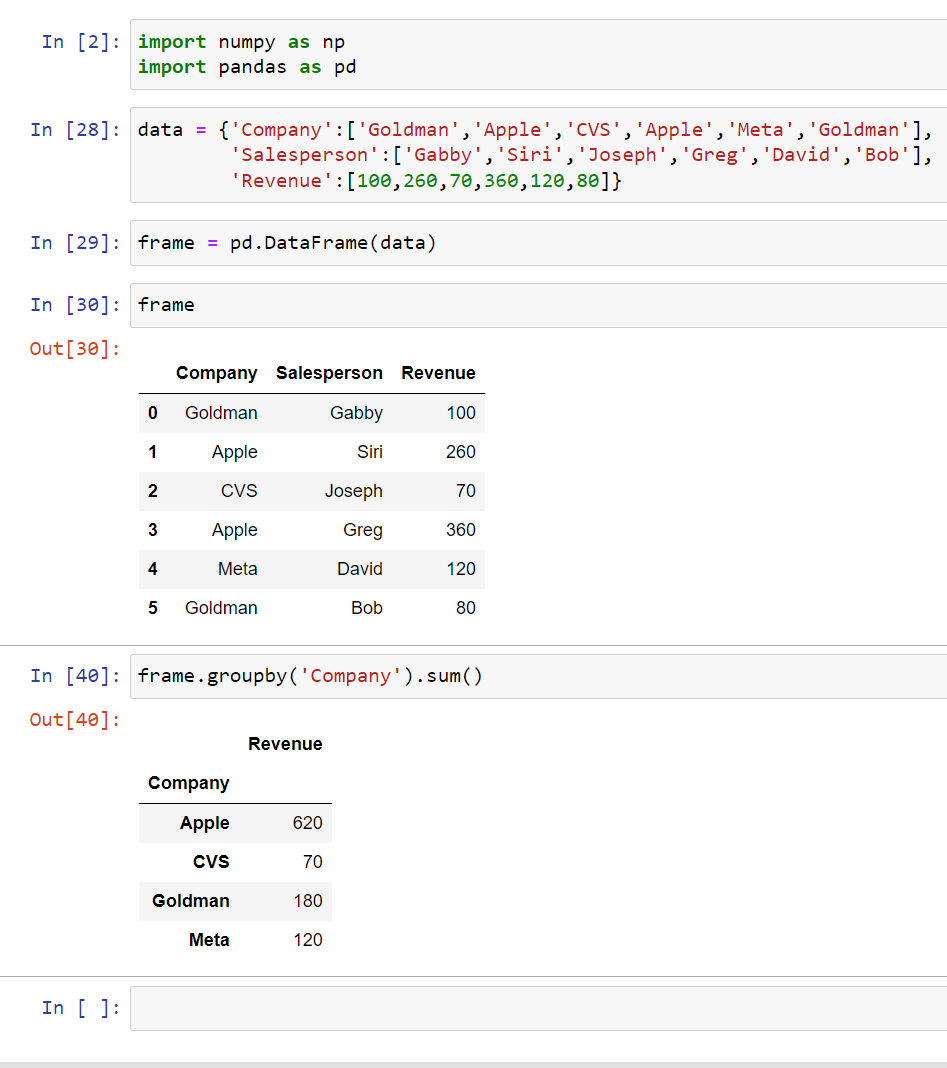
This is the same thing, but just in one line.
If you want to get a bunch of aggregate functions out of one line, you can write describe():

Concatenating
Concatenating will allow you to glue together DataFrames. Just note that dimensions should match along the axis. You can use pd.concat to pass in a list of DataFrames to concatenate together:
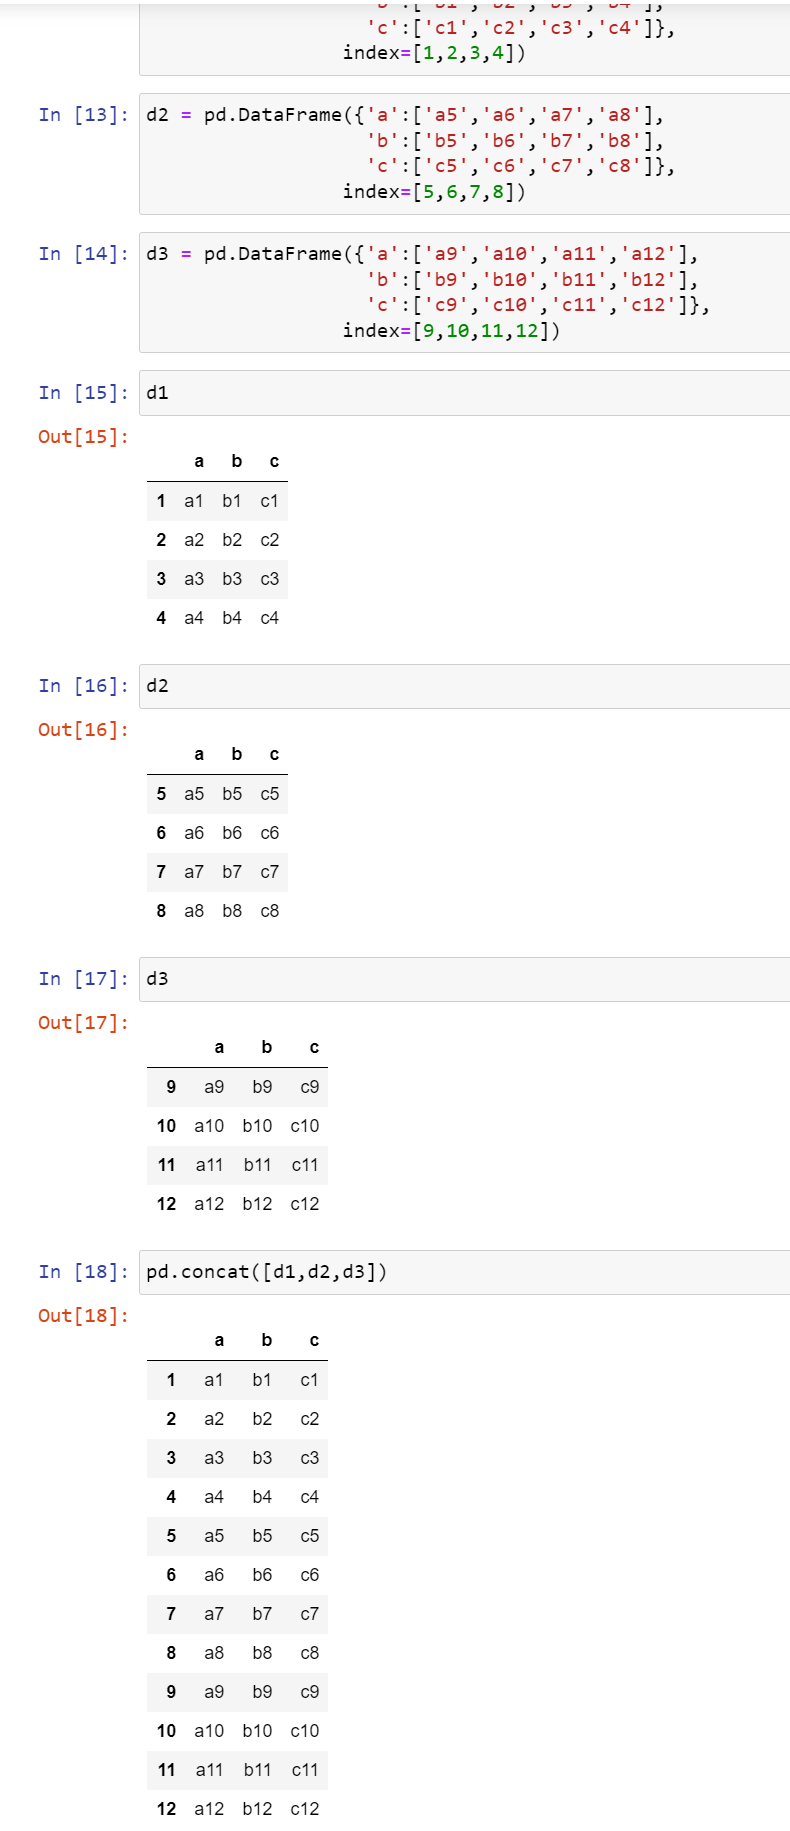
As you can see, it combined DataFrame d1, d2, and d3 together.
Merging
Merge will allow you to merge DataFrames together. It is similar to SQL joins. In order to merge you write pd.merge, pass in your DataFrame, then as default, it’s set to inner (similar to inner join in SQL) and then pass in your key column. Your key column should have values that match up for both DataFrame.

Joining
Joining will combine two differently-indexed DataFrames into a single DataFrame. This is similar to merging, but instead of a column, you would use an index.

You can also specify how such as inner, outer, left, right, etc:

[End of Part Two]