


Introduction to Pandas for Data Science: A Beginner's Guide (Part Three Final)
Final introduction to Pandas.

Operations
To find unique values in a DataFrame you would use unique():

This will return a Numpy array of all the unique values in a column. In this case, it returns all the unique values in column ‘b.’
If you want to know how many unique values there are in a column you would use nunique():

This would give me three as there are three unique values in column ‘b.’
If you want a more specific time a unique value occurs in a column, you would use value_counts():
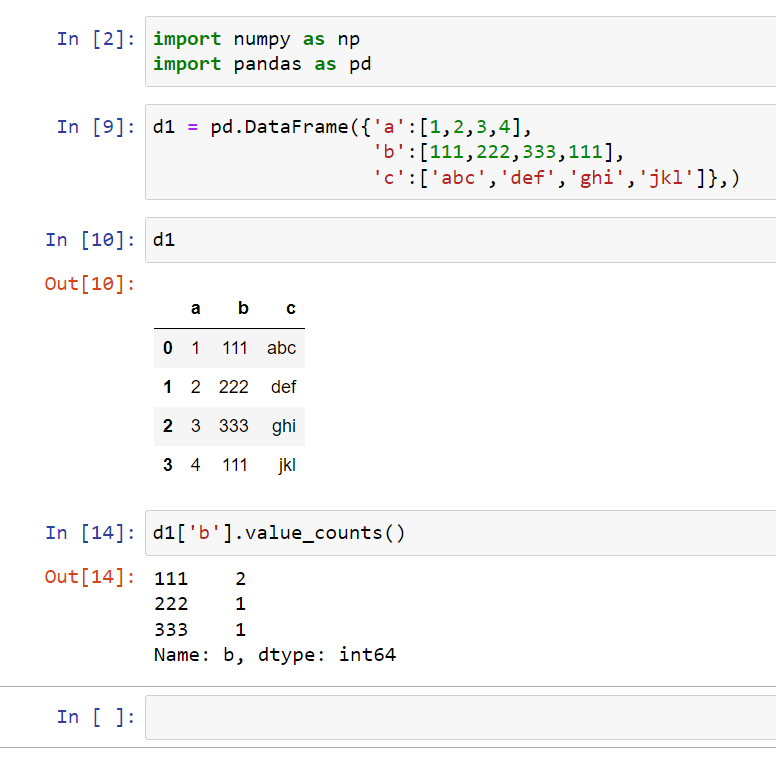
This would give me two values for ‘111’ as there are two of them and one value for ‘222’ and ‘333’ since there is only one of them.
We can use conditional selection to return the rows that you want. So in this case, if I wanted to return rows that have a value greater than two for column ‘a’, I write d1[d1['a']>2]:
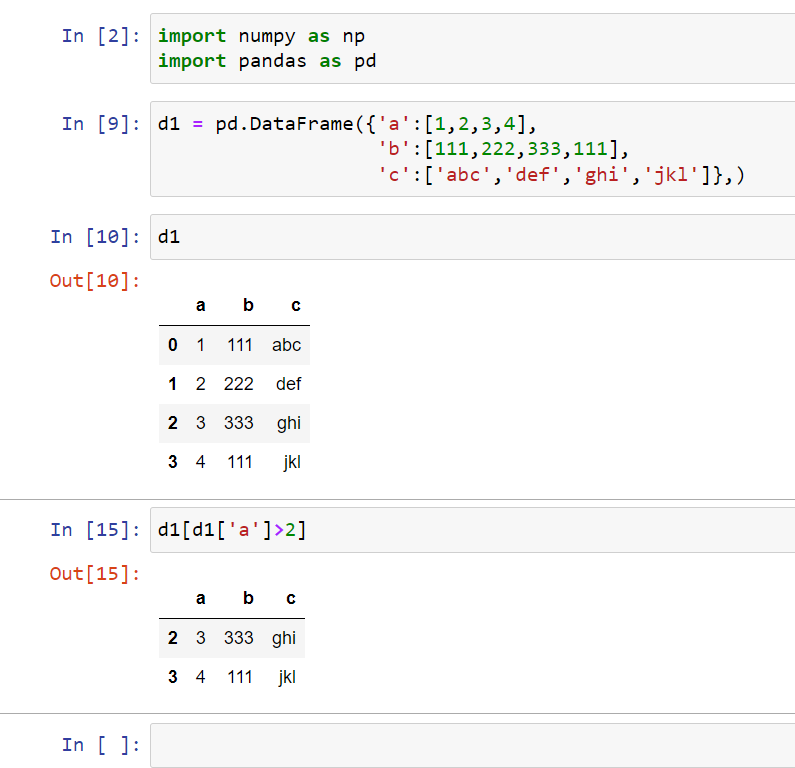
This would give me all the rows that are greater than two for that specific column.
We can combine conditions by wrapping them in parenthesis and using “&” for and or “|” for or such as:

Applied method
Sometimes we want to apply our own custom function such as multiplying a specific number. We can use apply() and then pass in whatever function you want to apply:

In this case, I want column ‘b’ values to be multiplied by three.
We can also use built-in functions such as len to see the length of each string:

Most of the time, you wouldn’t want to define an entire function if you’re going to apply it once. We would use lambda instead such as:
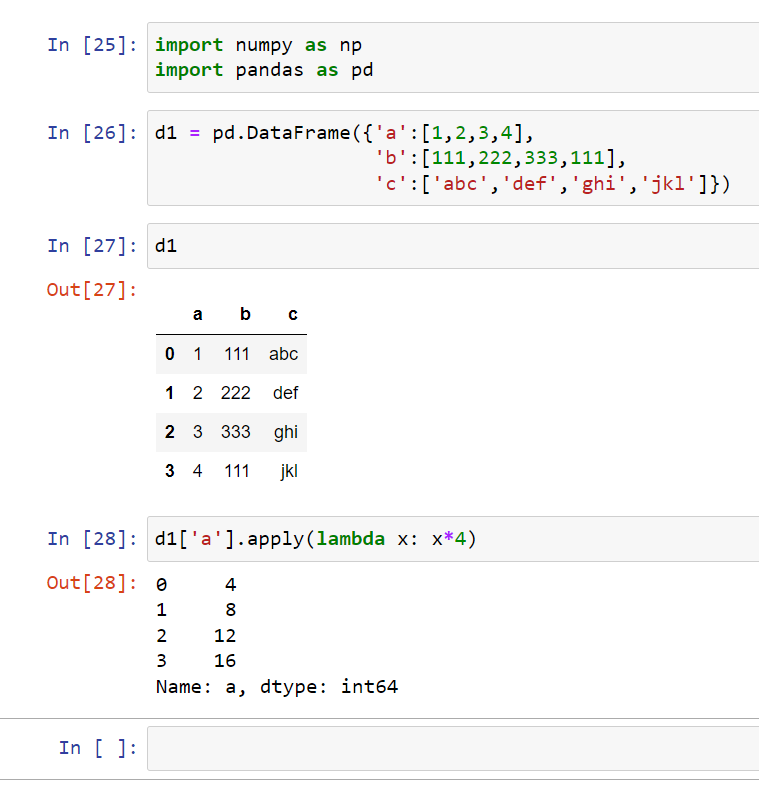
As you can see, I was able to multiply column ‘a’ by four without the need to write an entire function for it.
If you want to drop a column, you would use drop() and input your column, axis, and inplace such as:
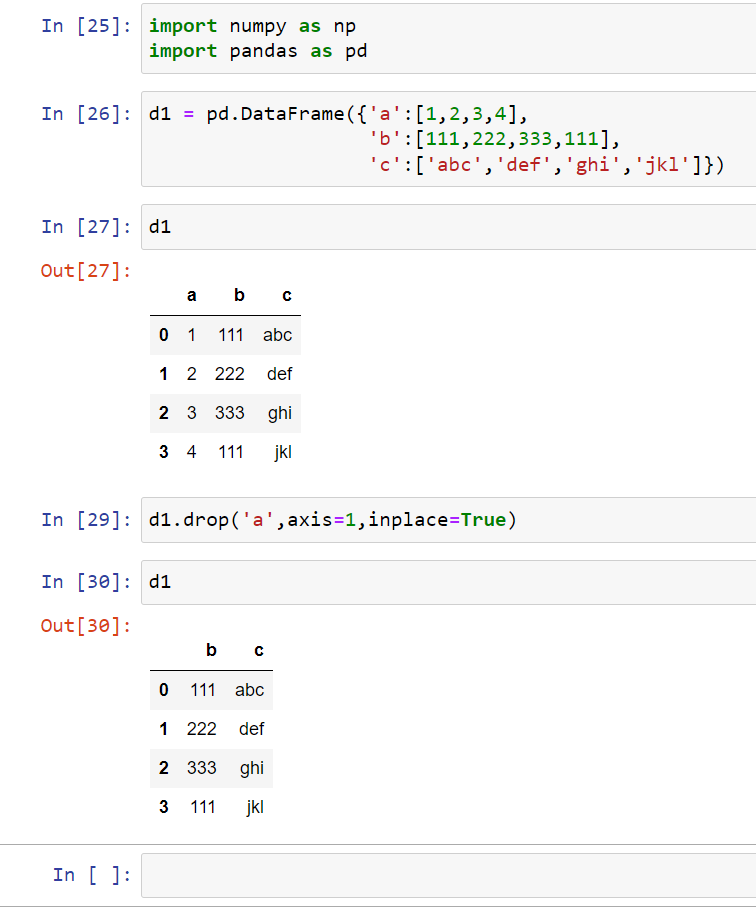
As you can see, I have dropped column ‘a.’
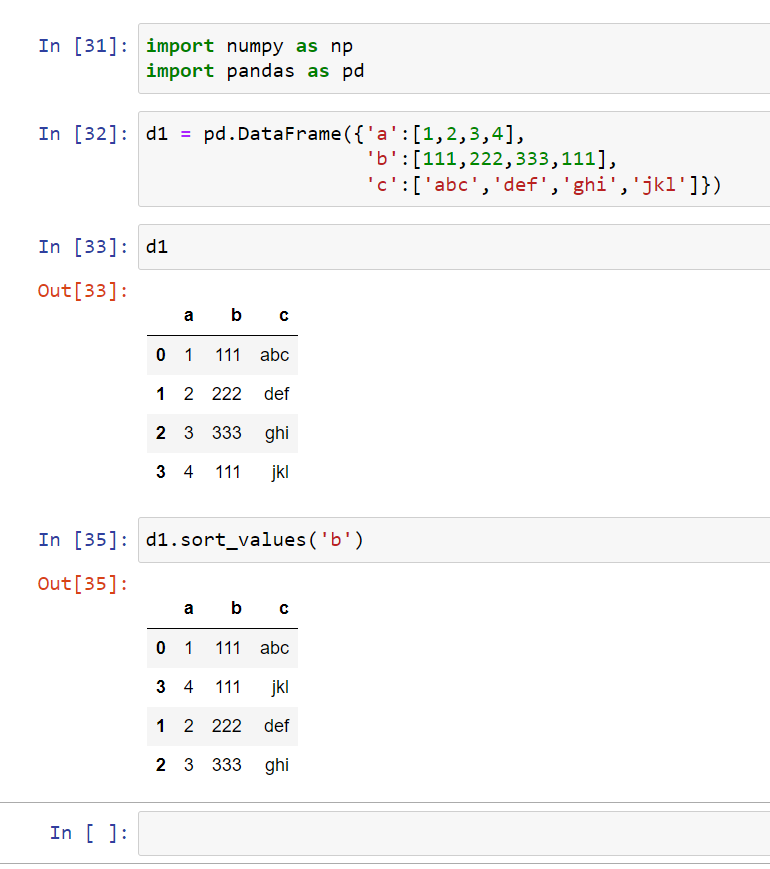
We can use sort_values() to sort the values from lowest to highest value:
Data Input and Output
Pandas have the ability to read and write data from multiple sources such as:
CSV
Excel
HTML
SQL
There is a lot more, but these are the most common.
Note I won’t be explaining how to read SQL because there are different database management systems such as PostgreSQL, MYSQL, SQLite, etc. Each one has a different syntax.
To get started you have to install using pip:
pip install sqlalchemy
pip install lxml
pip install html5lib
pip install BeautifulSoup4
pip install xlrd
Keep in mind that your CSV file and your Excel file have to be in the same location as your Jupyter Notebook. You can check by typing in ‘pwd’ in your Jupyter Notebook and then shift-enter and you can see the location.
In order to read CSV files you would write read_csv() and then input the name of your CSV file. In my case, I was doing some research on covid, so I just input the name of that CSV file:

To read Excel files you would write read_excel() and then input the name of your Excel file. In my case, I found some random Excel files:

To read HTML files you would write read_html() and then input the link to your HTML (some HTML will NOT work). In this case, I’m going to be using this link from FDIC failed bank:
https://www.fdic.gov/resources/resolutions/bank-failures/failed-bank-list/
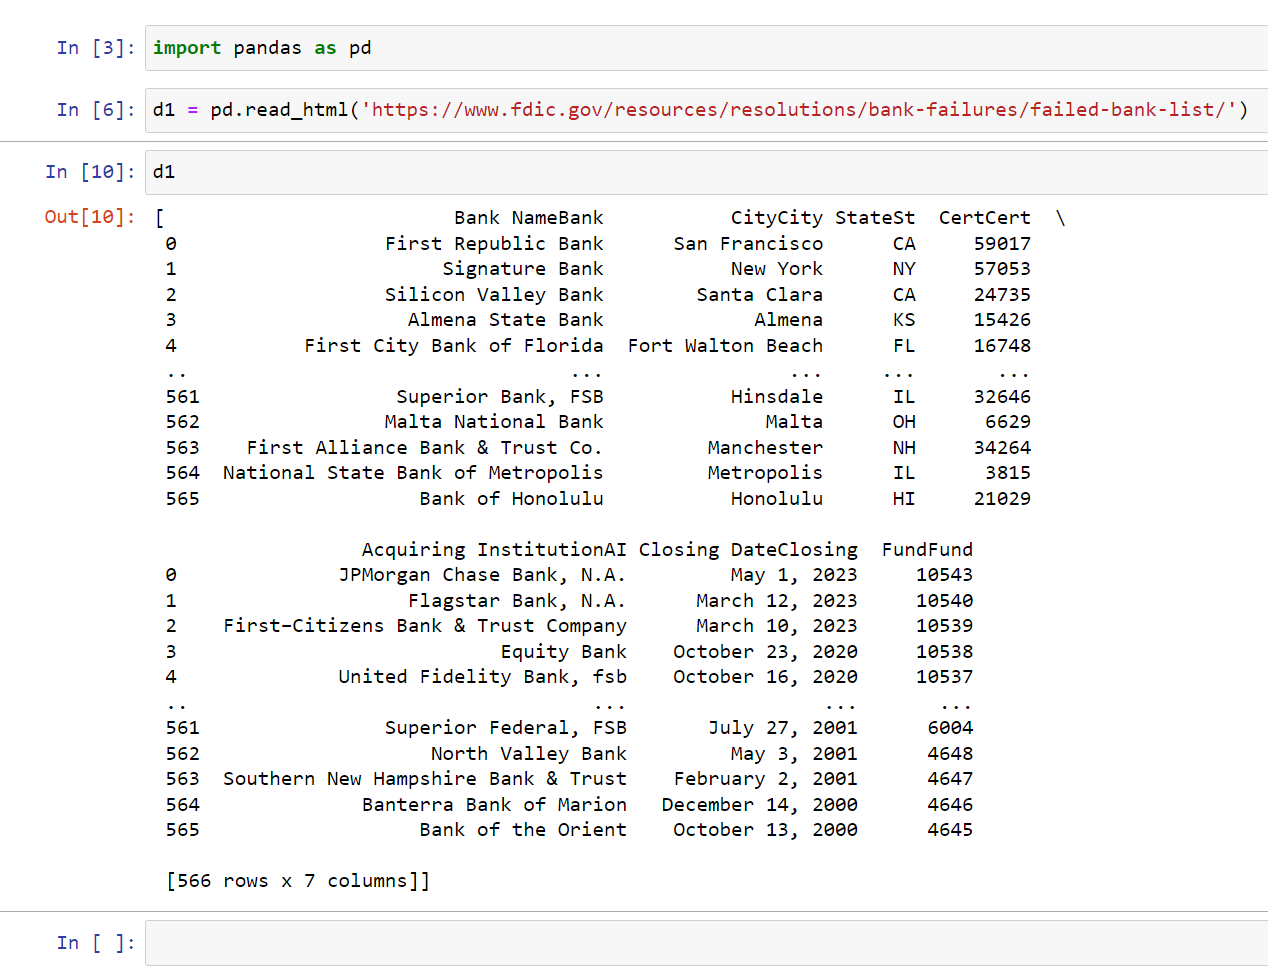
We can also use brackets and input zero to make it easier to read (this may not work for every website):

[End]