


Introduction to Pandas for Data Science: A Beginner's Guide (Part One)
Understanding pandas 🐼🐼🐼

Pandas allow for fast analysis and data cleaning and preparation.
It has a built-in visualization which I’ll write about in an upcoming article.
You can install pandas by typing in ‘pip install pandas’ into your command line or terminal
This is a library for Python, so you need to be familiar with Python
Series
A series is similar to a NumPy array. The difference is that a series can have axis labels (can be indexed by label).
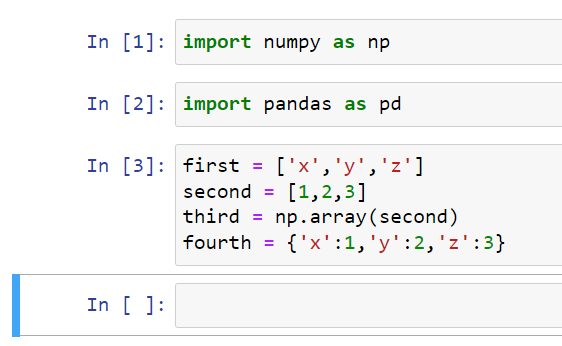
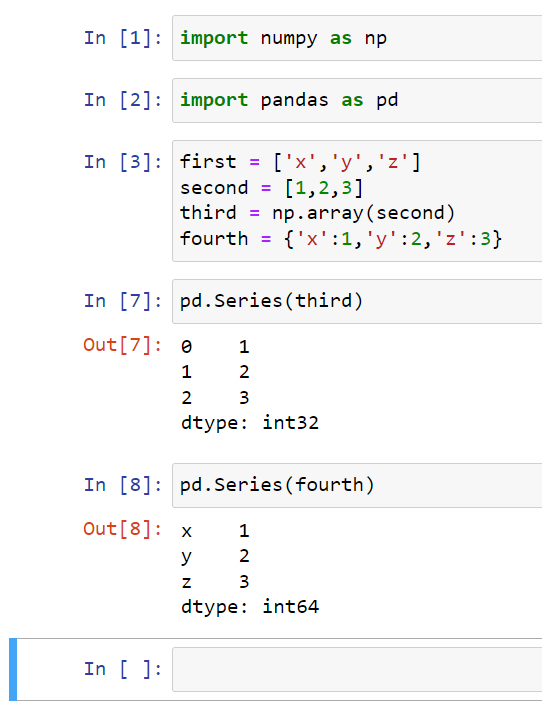
Let’s start by creating four Python objects. We’ll create a list (labeled as first), a number list (labeled as second), an array (labeled as third), and a dictionary (labeled as fourth):
You can create a series by typing in pd.Series().
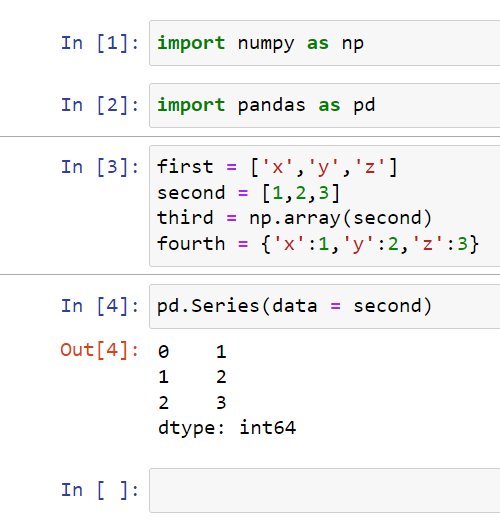
This would give us an index of 0,1,2 and then the actual data of 1,2,3.
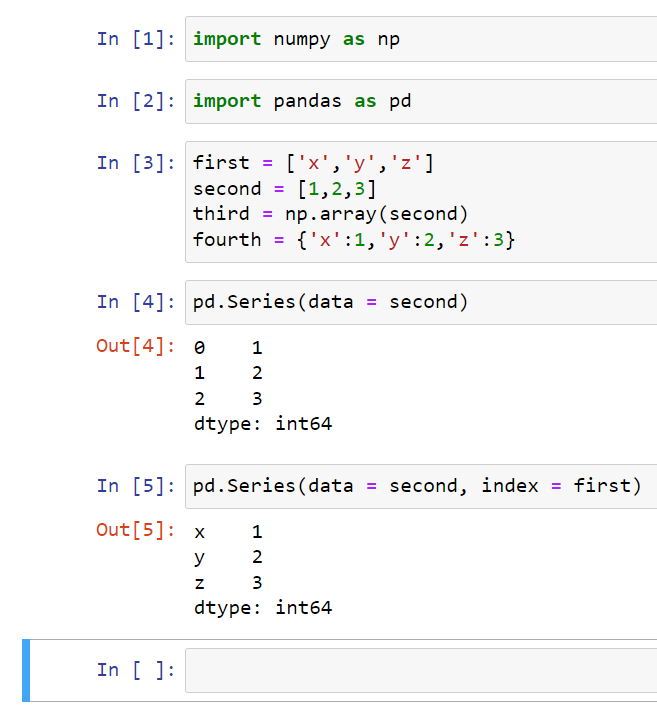
You can specify what you want that index to be. So in this case, we can specify that the index would equal the first list (x,y,z):
We can call the data by using the labeled index.
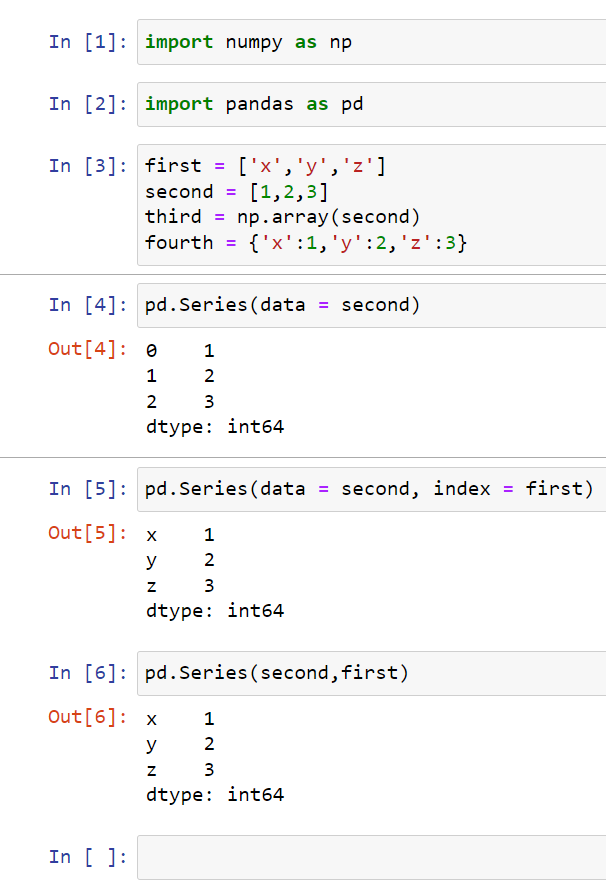
You don’t need to say data equals or index equals. Just make sure it’s in the correct order:
We can also use Series on an array and for a dictionary:
A series can hold almost every single type of data object with Python as its data point.
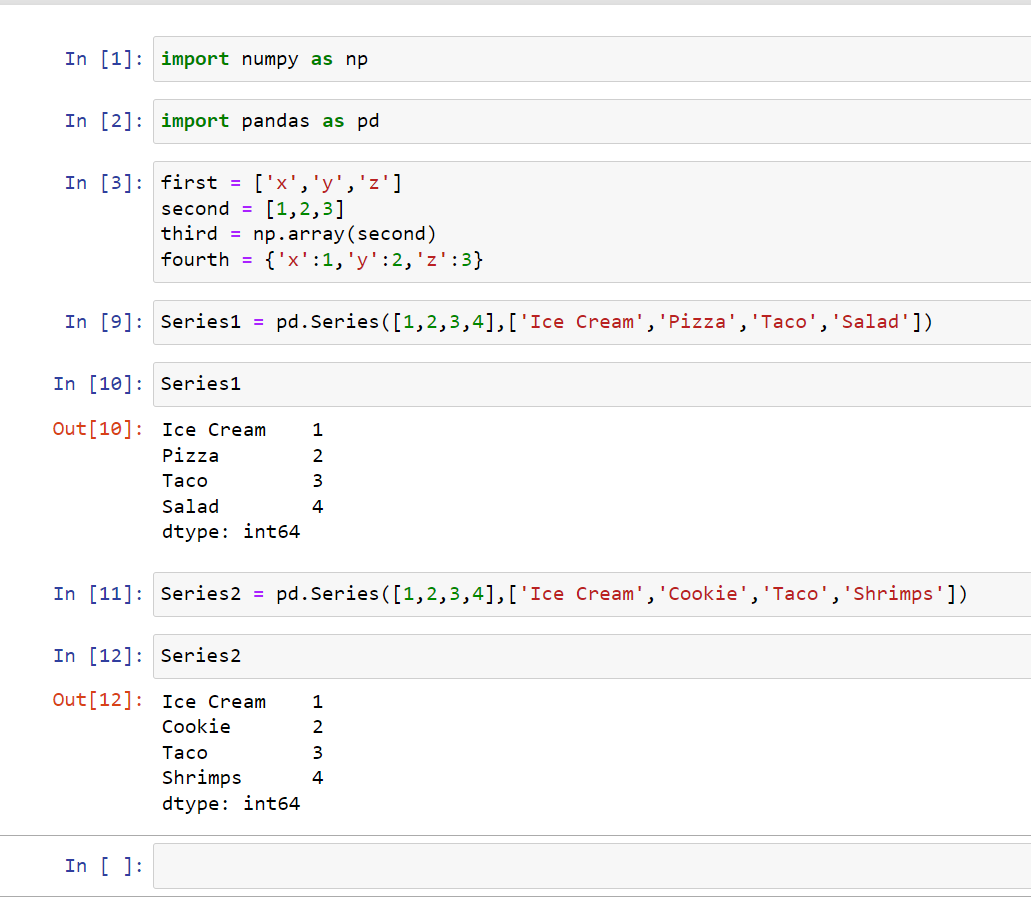
Series will allow us to look up information fast. So I’m going to create two series labeled as Series1 and Series2:
Series Grabbing
Grabbing information out of a series is similar to grabbing information out of Python dictionary. You just type in the index labeled and it’ll show you the data associated with that index:

Add Series
We can add series up but when the indexed don’t match one another, it’s going to show up as a null. In this case, Series1[Pizza] doesn’t match with Series2[Cookie], so it’s going to show a null, and Salad and Shrimp don’t match either, so that’s also null. The only thing that matches is Ice Cream and Taco, so we should see a value:
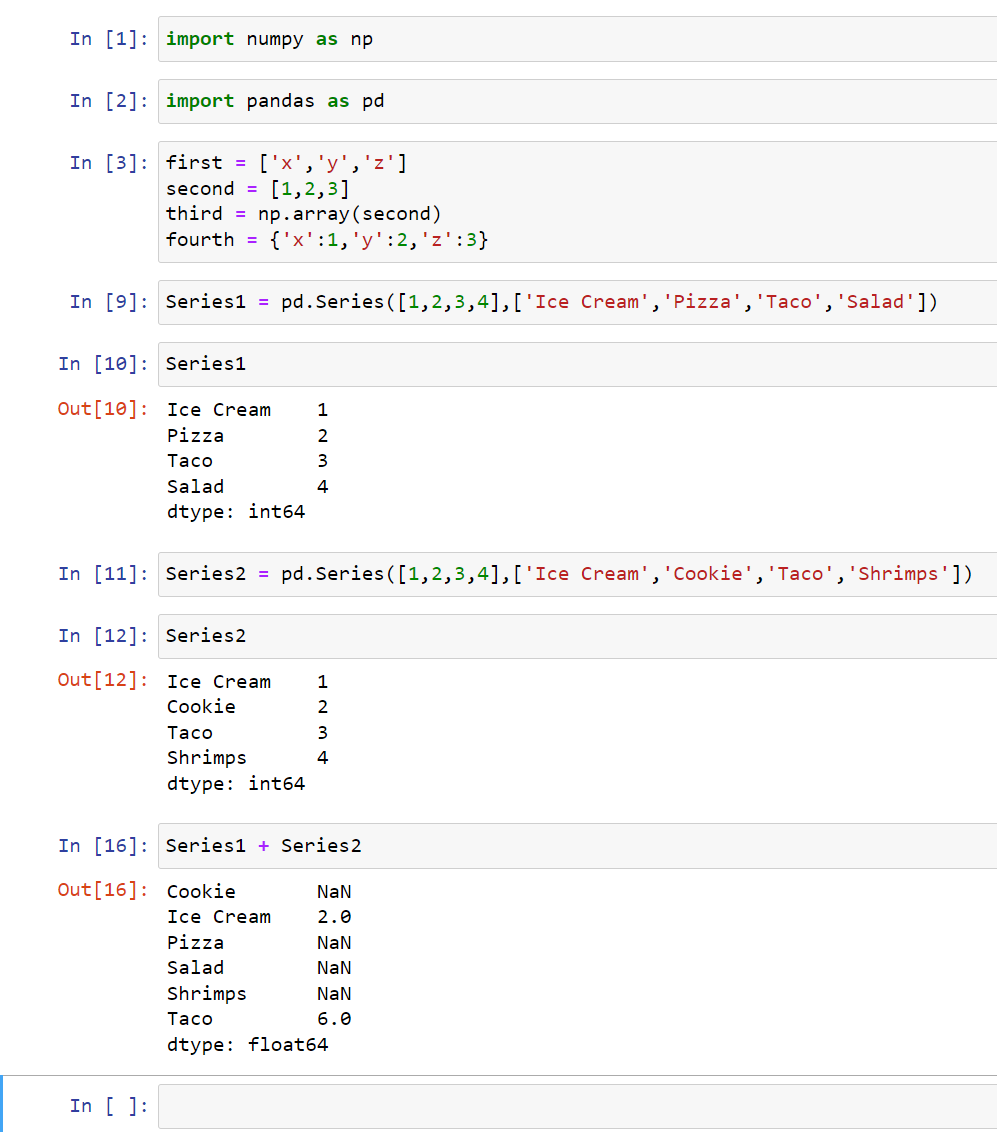
Your integers will be converted to floats just as a way you don’t accidentally lose information.
DataFrames
Dataframes are what we’re going to be using in pandas.
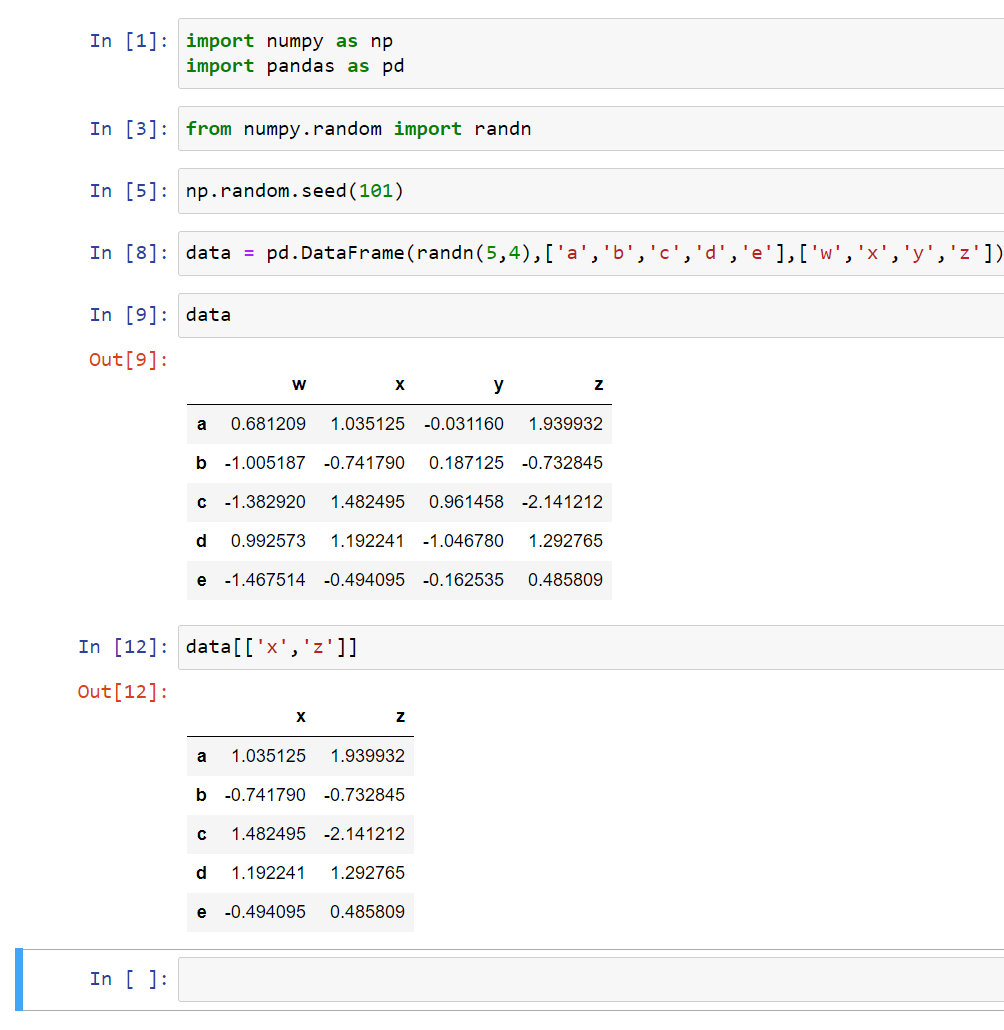
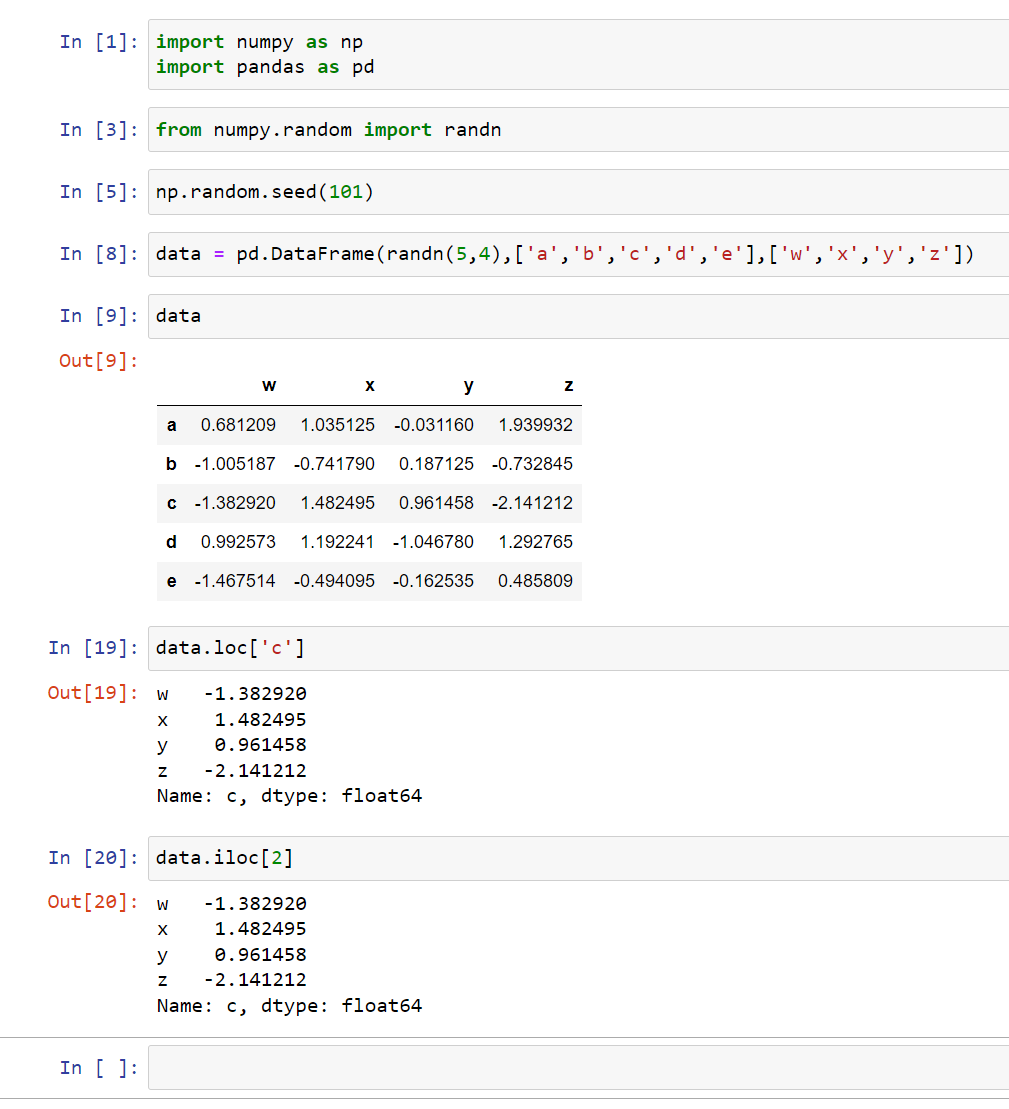
First, we pass in a data argument (randn) and then the index (a,b,c,d,e), and then the column (w,x,y,z):

We basically have columns and corresponding rows. Each of these columns is a pandas series (W is a series, X is a series, Y is a series, etc). They all share a common index.
Dataframes Grabbing
Now let’s try to grab one of these series objects. The simple and main way to do it is by using brackets and passing in the column name:

If you want multiple columns, you can pass in a list of columns:
New Columns
You can use other columns with arithmetic to create new columns:

Remove Columns
You can remove the column by using drop:
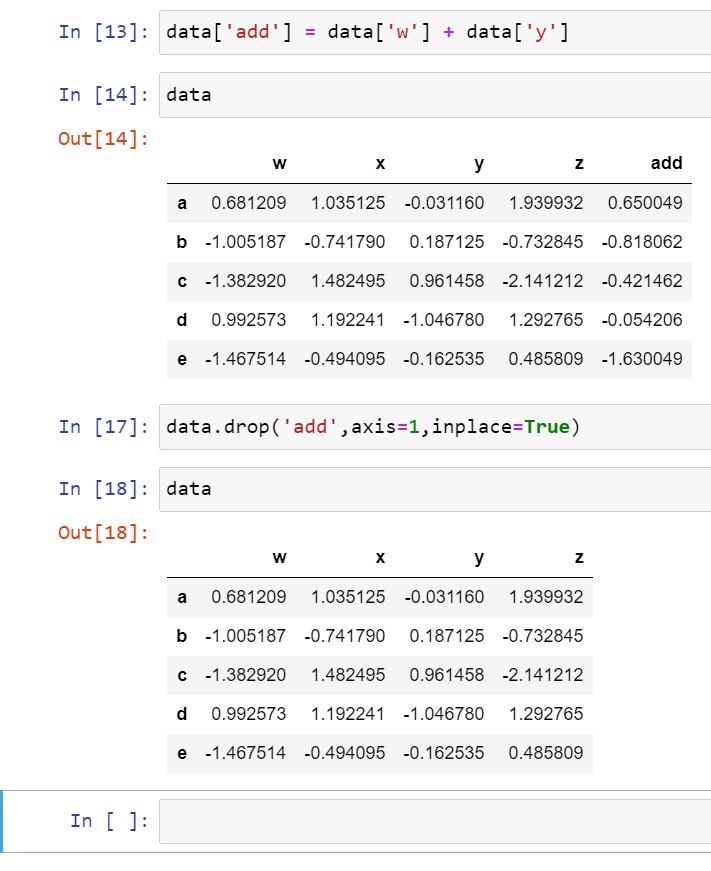
We can also do it with rows too just replace the column name with the row name and change axis=1 to axis=0.
Select rows
We can select rows too by using loc:

We can also use iloc if you want the numerical-based index:
Select specific values
If you want to get a specific value of rows and columns, we can pass in common notation (row we want and the column we want):

We can also get multiple specific rows by passing a list separated by commas:

Conditional selection
We can perform the conditional selection by using an operator similar to NumPy:
This would return true if it’s greater than 1 and false if it’s less than 1.
You can also do it with a specific column you want. In this case, just type ‘data['x']>1” and it’ll return boolean values for that specific column.
If you want to return all the values that are true then you can pass in your column name and your operator such as:

This will give you the rows that are true. If you look at our data, you notice that the b and e values are less than 1, so it’ll remove them.
We can get a specific column by adding brackets after the operator. In this case, I wanted columns y and z:

And
If you want to have multiple conditions and operators we have to use parenthesis and the & symbol:

This will give me the rows that are true for both x and z. It doesn’t give us the row if one of them is true and one of them is false. For example, column x row c is true, but column z row c is false, so it doesn’t return it. It only gave me a and d because both of them are true (greater than 1).
Or
If you want to do or operation then you have to use the pipe operator:

This will give me row c because one of them is true.
Multi-level index
This is what a data frame would look like if it has a multi-level index. It has two levels of index a and b and it also has a sub-level of 1,2,3.

Selection
We can pass in ‘a’ to grab everything from ‘a’:

We can continue indexing off of data.loc[‘a’] to get a more specific value:
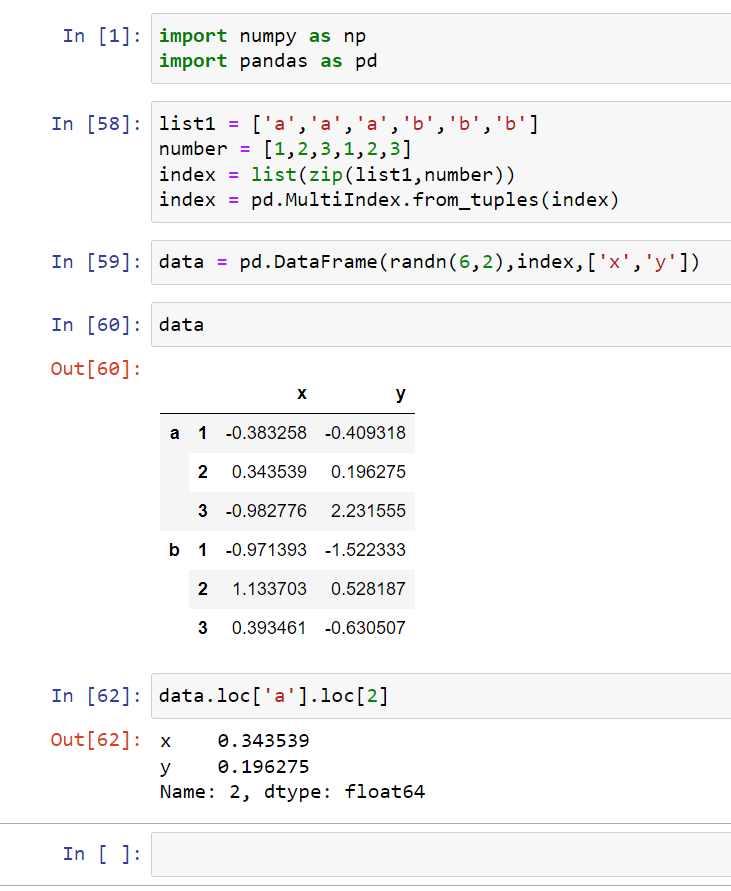
You first start with the outside index (‘a’ or ‘b’) and then begin to call from the inside (1,2, or 3).
If you want a single value then you can just put another bracket after the inside index name such as:

This would give me the value for row 3 column y on a.
Label
We can label it using data.index.names = []:

I labeled the outside index as ‘Groups’ and the inside index as ‘Numbers'.
Cross-section
The cross-section is perfect for selecting values in different groups. So if I wanted to get row 1 from both a and b, I can use data.xs() to do so (you also got to pass in the name for the argument, in my case it’s ‘Numbers’ as you can see above):

[End of Part One]